Using DOE in M-Star CFD
Overview
Factorial experiment designs help you determine the primary effects and interactions. This article shows how you can use an external Design of Experiments (DOE) software with M-Star CFD. We are using Stat Ease 360 for this example but this workflow works for other DOE software such as JMP. The basic workflow is:
Define DOE in external DOE Software
Copy design table into parameter sweep table in M-Star CFD GUI
Run M-Star CFD simulations using Queue
Collect results using Aggregator
Copy data from Aggregator into Stat Ease
Continue DOE analysis

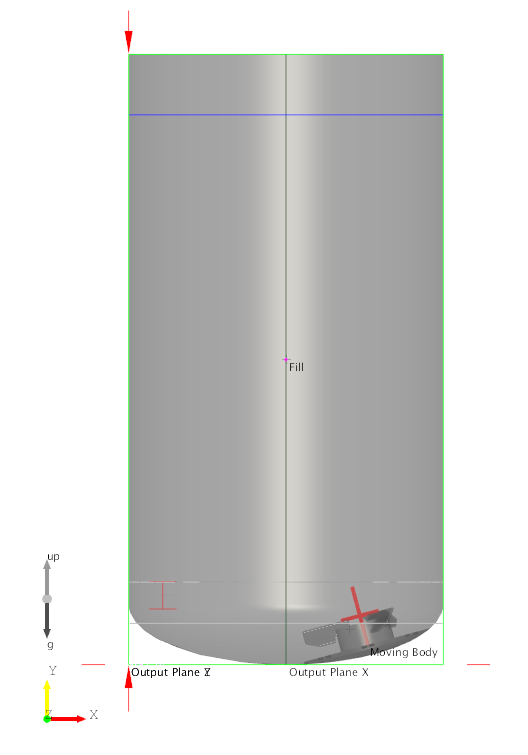
Model Description
Agitated vessel with bottom mounted impeller
200 L tank
Free surface model ON
Scalar injected at t=30s
Scalar relative standard deviation (RSD) computed
Simulation stops when scalar RSD is below 5. 30s minimum run time.
DOE Parameters
The system DOE parameters, ranges, and descriptions:
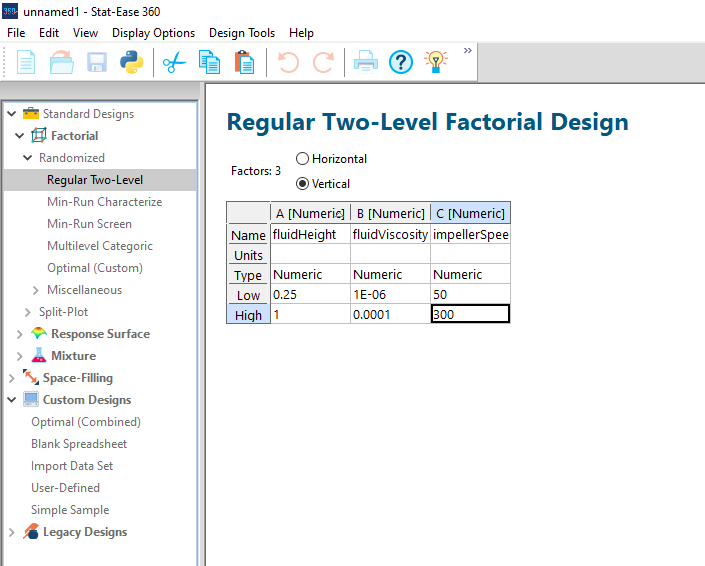
fluidHeight- 0.25 to 1.0 [m] - Height of fluid boxfluidViscosity- 1e-6 to 1e-4 [\(m^2/s\)] - Fluid kinematic viscosityimpellerSpeed- 50 to 300 [RPM] - Moving Body rotation speed
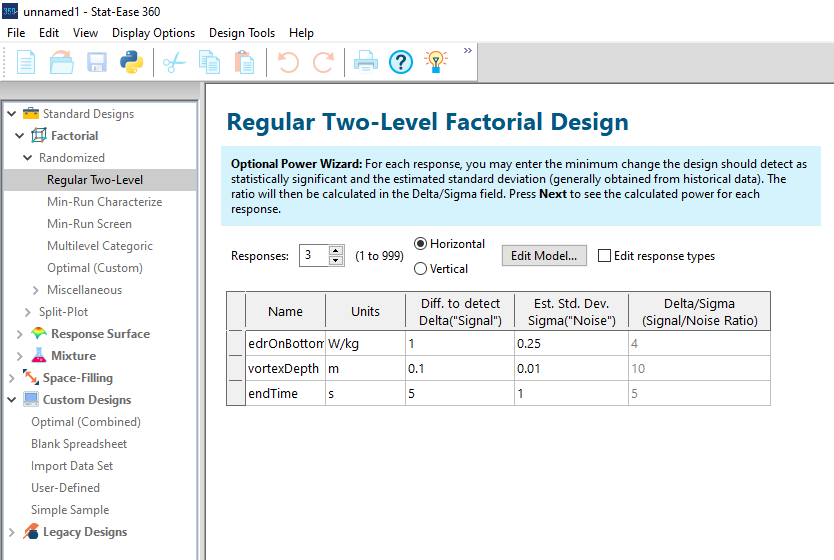
DOE Responses
The responses are global variables that compute response values at runtime.
edrOnBottom- [W/kg] - Maximum value of eddy dissipation ratevortexDepth- [m] - Minimum Y location of fluid interfaceendTime- [s] - The simulation run time. (Reminder that this value changes based on scalar RSD)
DOE Setup in Stat Ease 360
In this example we are doing a Regular Two-Level full factorial with 3 parameters in Stat Ease 360.
Parameter naming, range setup:
Response setup:
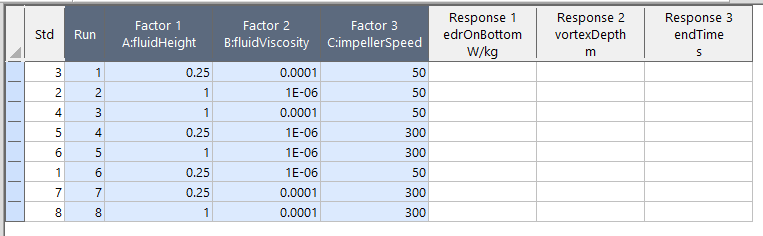
Resulting DOE table:
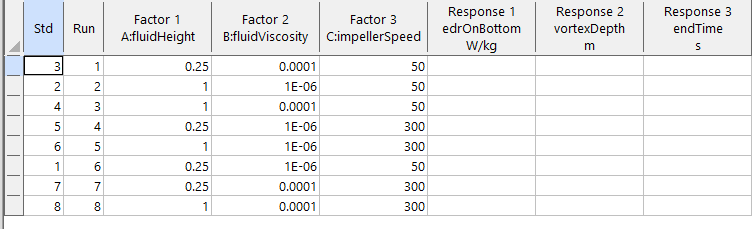
Each row in this table represents a simulation we need to run. We will copy/paste this table into a parameter sweep in M-Star CFD.
DOE Setup in M-Star CFD
In M-Star CFD GUI
Open the model in M-Star CFD
Create a new Parameter Sweep (Tools - Create parameter sweep)
Select the new parameter sweep object in the Workflow tab
Create the parameters in this order. Click Add Variable each time.
Add Variable. Select Fluid Height Box - Fluid Height
Add Variable. Select Free Surface - Kinematic Viscosity
Add Variable. Select Moving Body - Rotation Speed UDF
In DOE Software Window (Stat Ease)
Open the design table
Select the cells containing the design. In Stat Ease we can also select the Run column and use this for the case name in M-Star. It is recommended to use numbers for the case names to keep the sweep ordered properly.
Right click - Copy
Note that you should not change the order of this table after this point in the DOE software
In M-Star CFD GUI
Click Edit to open the parameter sweep table
Verify the parameter columns have the same order as the DOE software. If not, you can copy/paste each column separately.
Select the first cell in the table under Case Name
Paste the data into the table. Use CTRL-V or right click - Paste. Note that data on this form are converted to a double precision floating point value. In this case this has resulted in the value “1e-6” to be converted to “9.99999999e-7” due to the limitation of double precision to represent the value 1e-6 exactly.
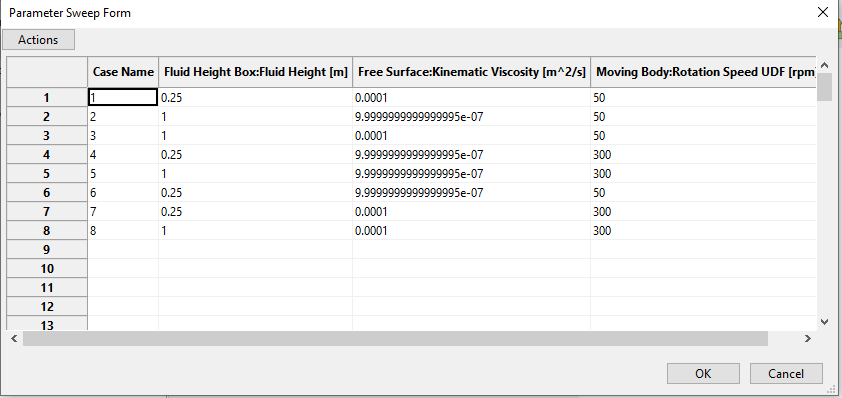
Click OK to save the table
Save the MSB model
Run the DOE
We now need to run the simulations defined in the parameter sweep. We will use the M-Star CFD Queue for this purpose. Alternatively, you can export the parameter sweep cases and run them using your own mechanism, or even use the M-Star Python API to export the sweep.
In M-Star CFD GUI
Open the MSB file with the parameter sweep defined if not already done
Click the Solve drop down on the main tool bar. Solve - Add parameter sweep to queue.
Choose a new empty directory
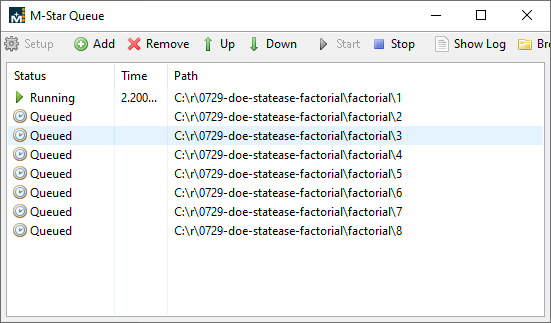
The M-Star Queue should open with the cases now added to the list
In M-Star CFD Queue
Click Start
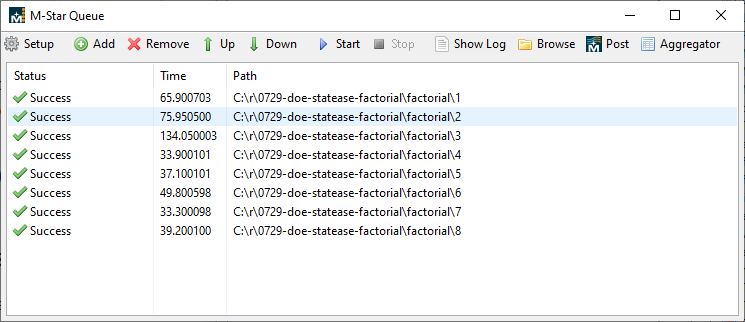
Wait for all simulations to finish
Click Aggregator button. A new Output Aggregator window will appear with the cases listed
Copy results into DOE Software
In M-Star Aggregator
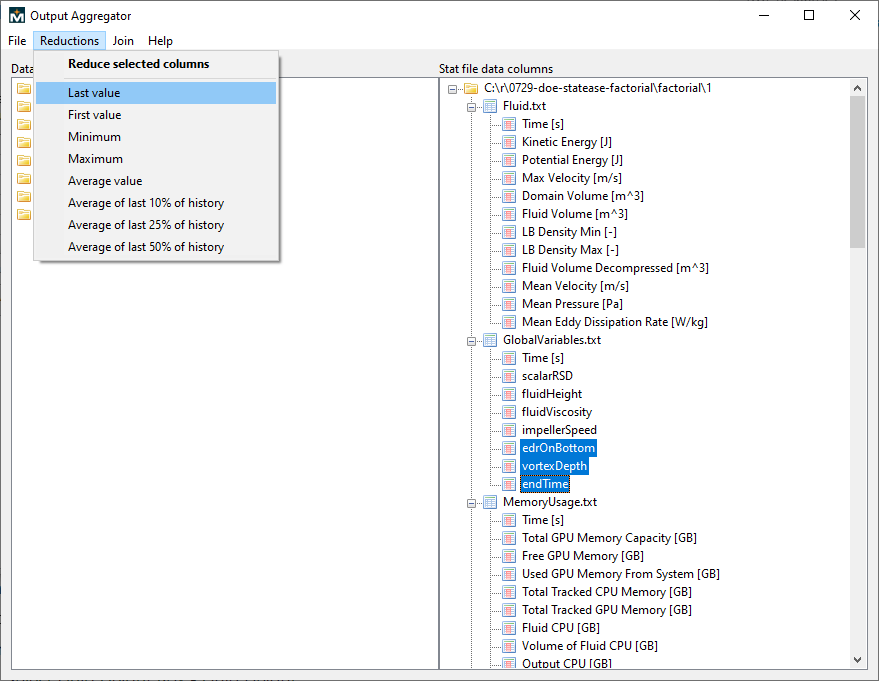
Under GlobalVariables.txt, select each of the response variable names: edrOnBottom, vortexDepth, endTime
Click Reductions - Last Value
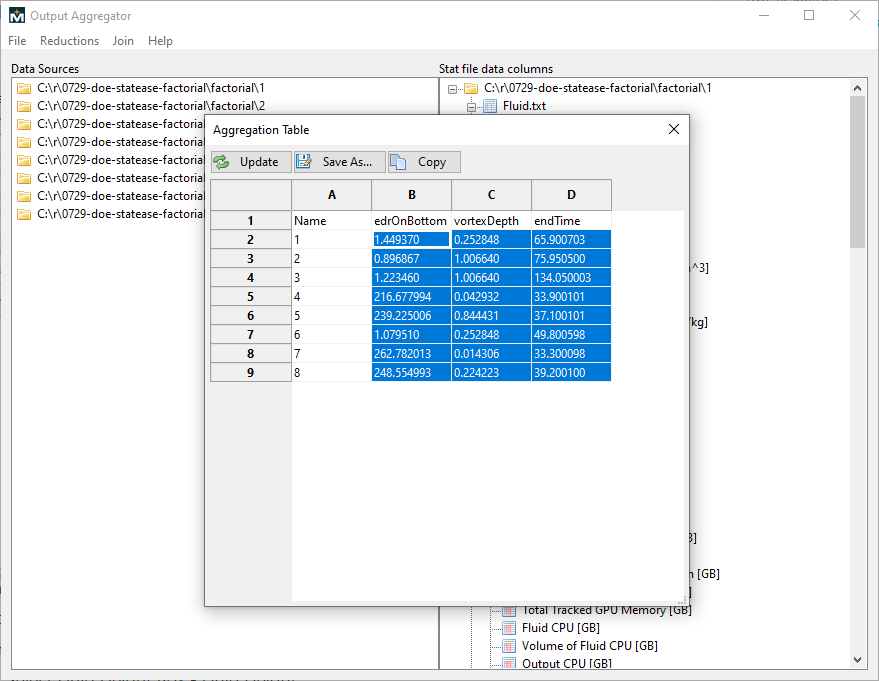
Select the response data
Right click on a selected cell, click Copy
In DOE software window (Stat Ease)
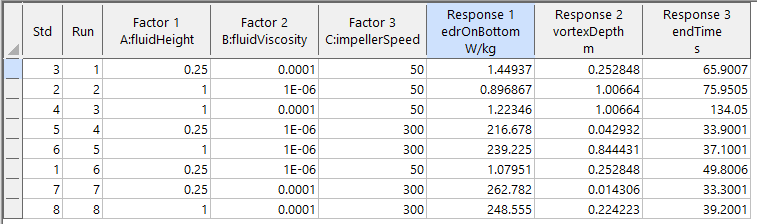
Open the design table
Paste results into DOE table
Save file
Continue DOE Analysis
The rest of this article is specific to Stat Ease 360. Follow along or feel free to refer to the documentation in your DOE software concerning analysis of full factorial results.
Continue the DOE analysis by looking at response data and creating models.
edrOnBottom
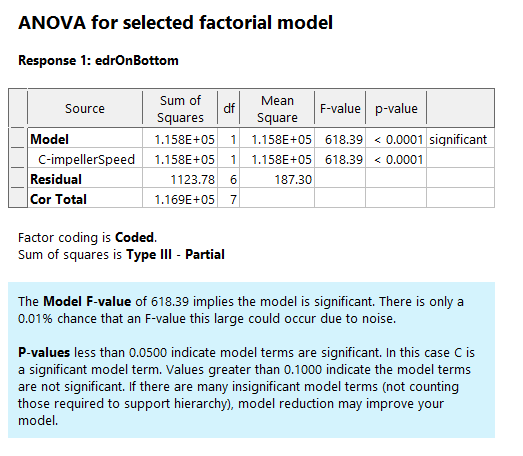
Under Analysis click on the first response edrOnBottom. Click Start Analysis.
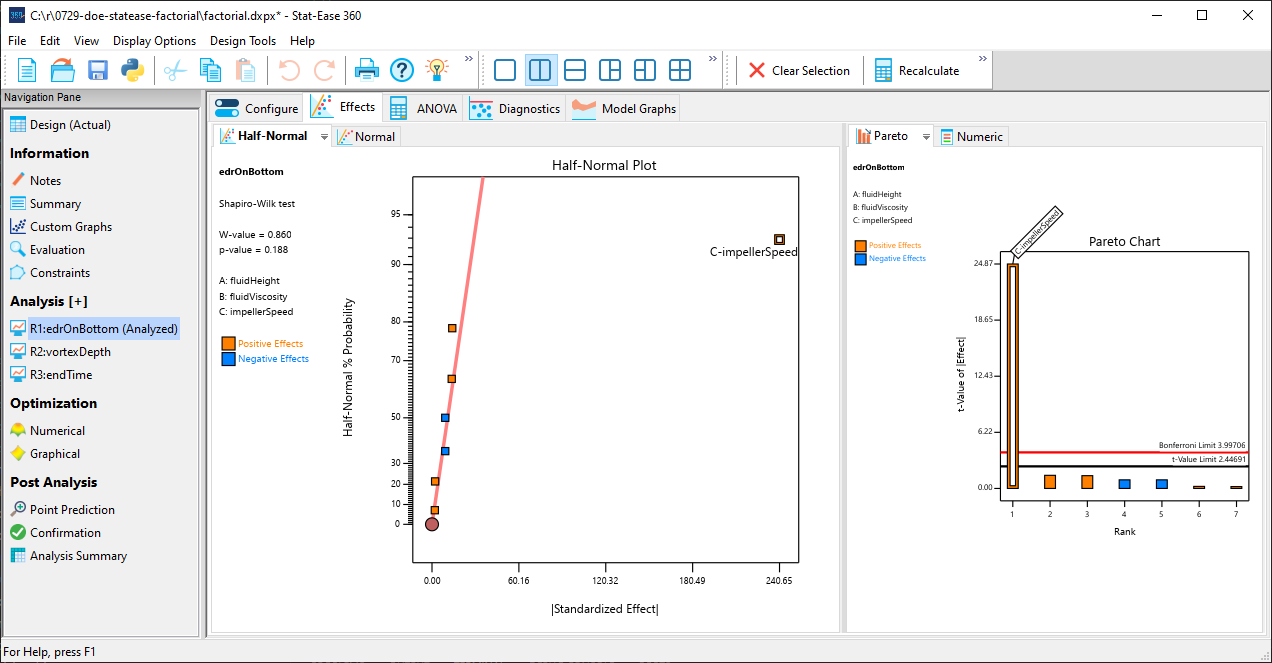
We can see here the impeller speed is the really the only relevant parameter for this response. Select the points that are off of the line and click ANOVA.
The ANOVA results verify the impeller speed is significant for the model.
vortexDepth
Under Analysis select vortexDepth. Click Start Analysis.
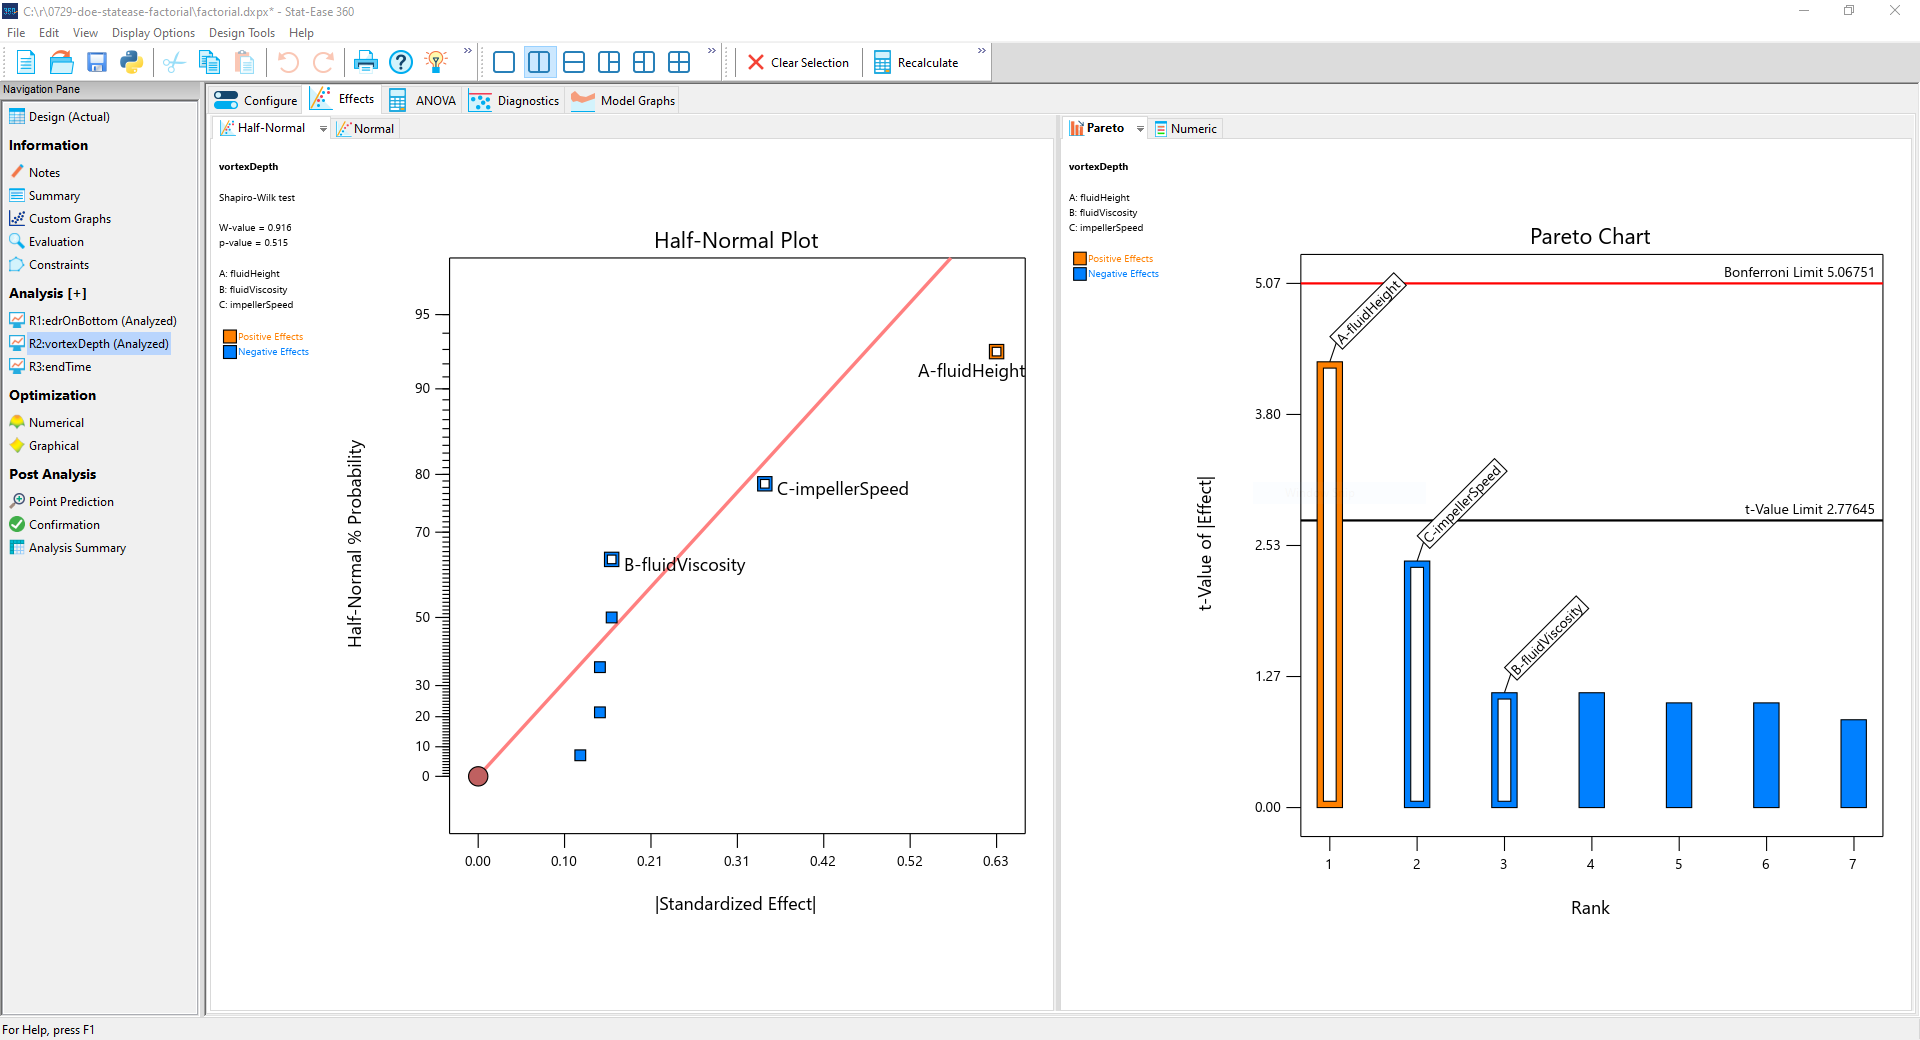
Select the responses and click ANOVA. In this model we select the impellerSpeed, fluidViscosity and fluidHeight. With this model we have acheived a p-value of 0.0329 which is considered significant.
Click Model Graphs and select the Profiler.
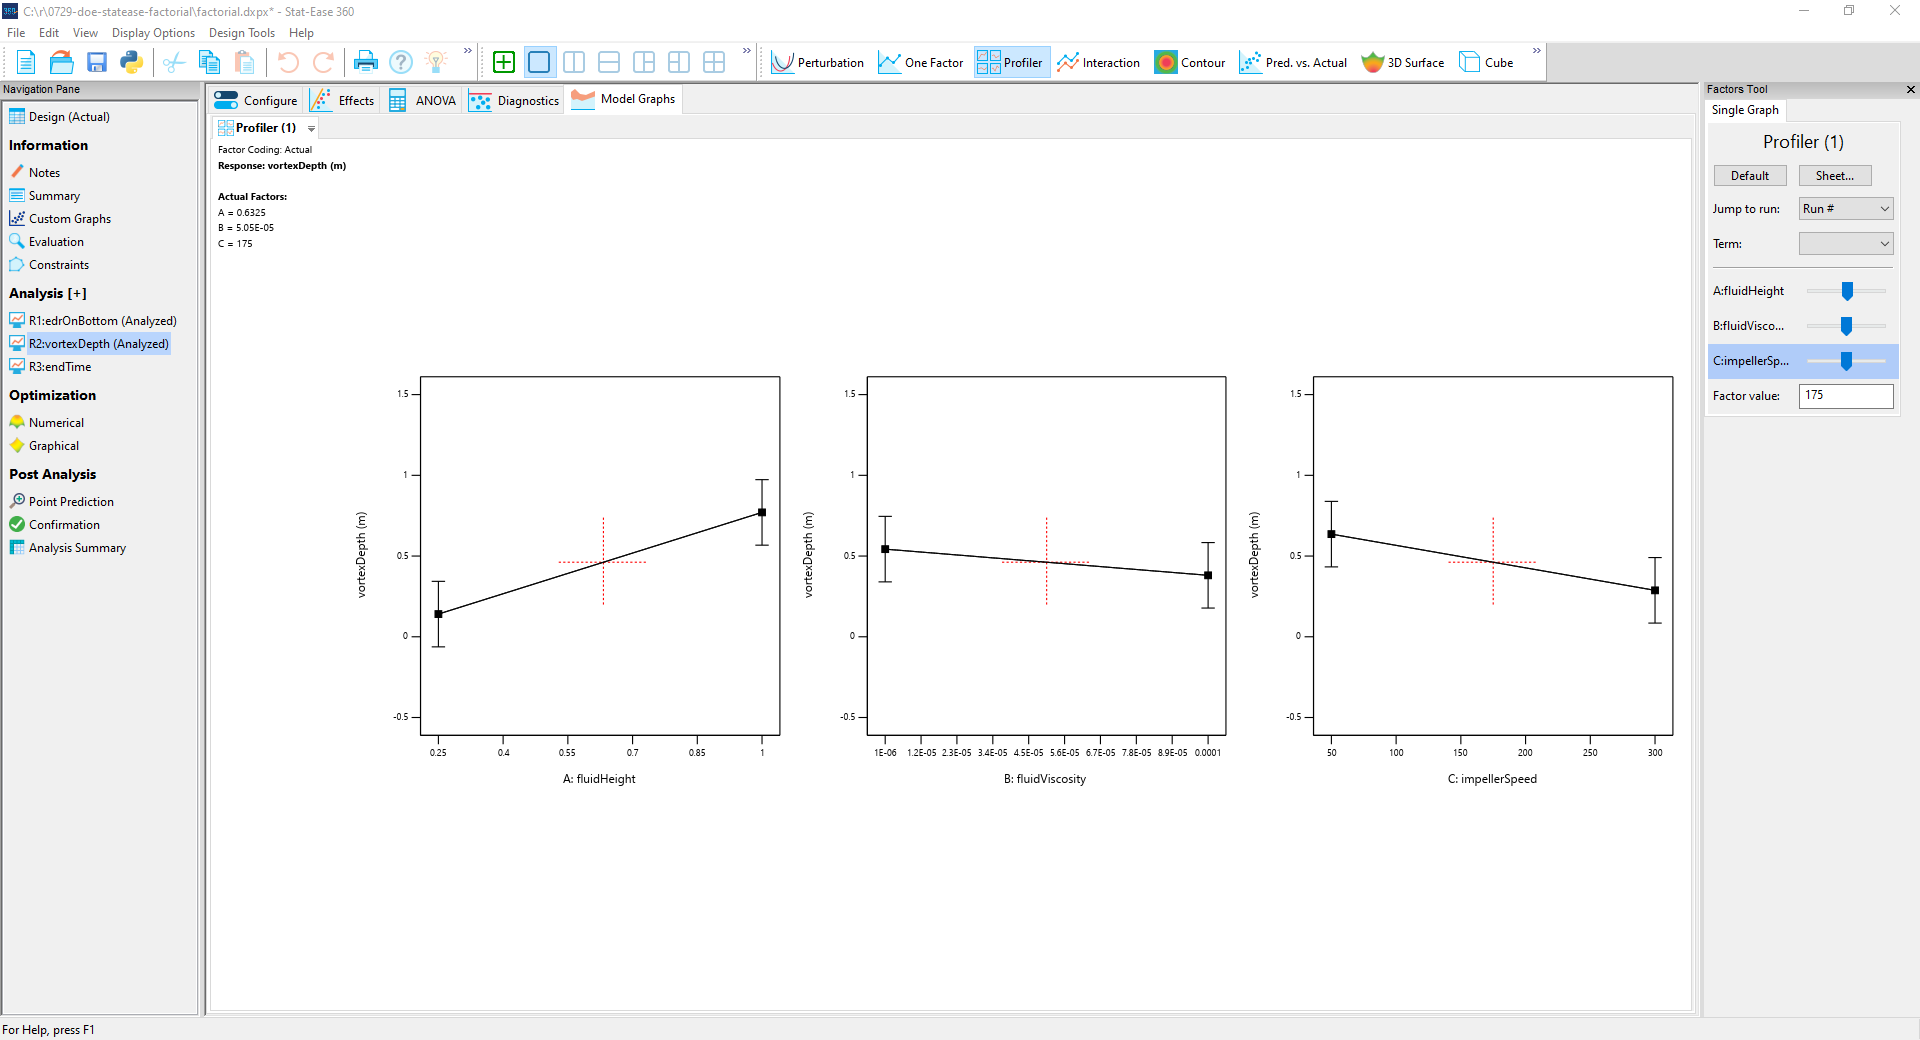
Manipulate the model inputs to see how the results change. It is apparent that the fluid height drives the largest change in this response. The viscosity and impeller speed impact the response to a limited extent.
endTime
Under Analysis select endTime. Click Start Analysis.
Select the C-impellerSpeed parameter. Selecting other parameters causes the model p-value to become insignificant. Click ANOVA and see that the impeller speed is the primary parameter.